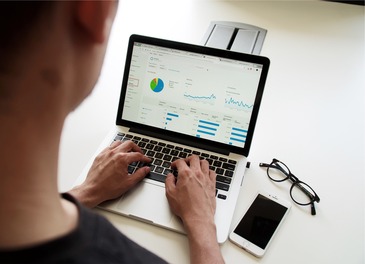
This collection includes openly licensed resources on the topic of data literacy. Data literate individuals will understand how to read and interpret data and visualizations and how to use and present data for their own purposes.
Collection thumbnails for Data Literacy is from Unsplash.
The Stanford History Education Group (SHEG) is a research and development group …
The Stanford History Education Group (SHEG) is a research and development group based in Stanford’s Graduate School of Education. In 2014, we set out to develop short assessments to gauge young people’s ability to evaluate online content. Our work was supported by the Robert R. McCormick Foundation, the William and Flora Hewlett Foundation, the Spencer Foundation, and the Silver Giving Foundation. Specifically, we sought to measure Civic Online Reasoning — the ability to effectively search for, evaluate, and verify social and political information online. We use this term to highlight the civic aims of this work. The ability to evaluate online content has become a prerequisite for thoughtful democratic participation.
A short course for students to increase their proficiency in analyzing and …
A short course for students to increase their proficiency in analyzing and interpreting data visualizations. By completing this short course students will be able to explain the importance of data literacy, identify data visualization issues in order to improve their own skills in data story-telling. The intended outcome of this course is to help students become more discerning and critical users of data, graphs, charts and infographics.
Are you ready to leave the sandbox and go for the real …
Are you ready to leave the sandbox and go for the real deal? Have you followed Data Analysis: Take It to the MAX() and Data Analysis: Visualization and Dashboard Design and are ready to carry out more robust data analysis?
In this project-based course you will engage in a real data analysis project that simulates the complexity and challenges of data analysts at work. Testing, data wrangling, Pivot Tables, sparklines? Now that you have mastered them you are ready to apply them all and carry out an independent data analysis.
For your project, you will pick one raw dataset out of several options, which you will turn into a dashboard. You will begin with a business question that is related to the dataset that you choose. The datasets will touch upon different business domains, such as revenue management, call-center management, investment, etc.
Struggling with data at work? Wasting valuable time working in multiple spreadsheets …
Struggling with data at work? Wasting valuable time working in multiple spreadsheets to gain an overview of your business? Find it hard to gain sharp insights from piles of data on your desktop?
If you are looking to enhance your efficiency in the office and improve your performance by making sense of data faster and smarter, then this advanced data analysis course is for you.
If you have already sharpened your spreadsheet skills in Data Analysis: Take It to the MAX(), this course will help you dig deeper. You will learn advanced techniques for robust data analysis in a business environment. This course covers the main tasks required from data analysts today, including importing, summarizing, interpreting, analyzing and visualizing data. It aims to equip you with the tools that will enable you to be an independent data analyst. Most techniques will be taught in Excel with add-ons and free tools available online. We encourage you to use your own data in this course but if not available, the course team can provide.
These course materials are part of an online course of TU Delft. Do you want to experience an active exchange of information between academic staff and students? Then join the community of online learners and enroll in this MOOC. This course is part of the Data Analysis XSeries.
We facilitate and develop lessons for Data Carpentry workshops. These lessons are …
We facilitate and develop lessons for Data Carpentry workshops. These lessons are distributed under the CC-BY license and are free for re-use or adaptation, with attribution. We’ve had people use the lessons in courses, to build new lessons, or use them for self-guided learning.
Data Carpentry workshops are domain-specific, so that we are teaching researchers the skills most relevant to their domain and using examples from their type of work. Therefore we have several types of workshops and curriculum is organized by domain.
This session was part of an undergraduate, critical thinking and global perspectives …
This session was part of an undergraduate, critical thinking and global perspectives course. The course is offered by various disciplines on campus. This instance focused on global challenges (The Seven Revolutions developed by csis.org). For the session the students applied two frameworks to data: authority is constructed and contextual and scholarship as conversation. Students learned about a data life cycle concept with emphasis on evaluation.
The Data Notebook is an online suite of open interactive resources that …
The Data Notebook is an online suite of open interactive resources that provides instructional materials for introductory data analytics and data visualization approaches relevant to a wide range of subjects and disciplines. Specifically, this book focuses on principles related to data storytelling, and provides tangible research steps and include case studies, mini-lessons, and interactive instructional components.
Data talks are short 5-10 minute classroom discussions to help students develop …
Data talks are short 5-10 minute classroom discussions to help students develop data literacy. This pedagogical strategy is similar in structure to a number talk, but instead of numbers students are shown a data visual and asked what interests them
Data Viz Project started out as an internal tool box, where we …
Data Viz Project started out as an internal tool box, where we simply stuck data visualizations up on our wall as visual inspiration. Of course, there are a lot of books, websites, libraries, and tools that include a lot of visualization types, but not as comprehensive and logical as we liked. So instead of continuing to stick these visualizations on our wall, we thought we might as well just put it online, so you and others can use it as a tool and inspiration.
Digital literacy is a ‘life skill’ in which individuals develop skills and …
Digital literacy is a ‘life skill’ in which individuals develop skills and abilities, using digital tools appropriately to locate, evaluate, analyze, synthesize and construct new knowledge, communicate and interact with others in a creative and transformative way.
According to the bibliography, DL is a multidimensional literacy that involves a technical/ operational dimension which refers to mechanical and practical skills; a cognitive dimension related to Information literacy skills and content creation skills; and a social-emotional dimension which focuses on an individual’s development to communicate with others and enable social action
A six module course that goes over evaluating online information, working with different digital formats, ethical communication and sharing of information, and understanding online risks and threats.
Focus is on creating and selecting high quality assessments, integrating assessment practices …
Focus is on creating and selecting high quality assessments, integrating assessment practices and results into actions and planning, and building and enhancing data literacy skills related to assessment.
This interactive webcomic marks the first of our WI+RE Data Literacy Suite. …
This interactive webcomic marks the first of our WI+RE Data Literacy Suite. Intro to Data Literacy introduces learners to a variety of ways different academic disciplines conduct data research!
Library Carpentry workshops teach people working in library- and information-related roles how …
Library Carpentry workshops teach people working in library- and information-related roles how to:
Cut through the jargon terms and phrases of software development and data science and apply concepts from these fields in library tasks; Identify and use best practices in data structures; Learn how to programmatically transform and map data from one form to another; Work effectively with researchers, IT, and systems colleagues; Automate repetitive, error prone tasks.
Scholars are pursuing an international reputation earlier in their careers. Early career …
Scholars are pursuing an international reputation earlier in their careers. Early career researchers often encounter norms and expectations they may be unfamiliar with, specifically open access publishing, research data sharing mandates and establishing their scholarly identity via professional social media. They must learn to navigate the research lifecycle from topic selection to data collection and ultimately dissemination of their work. This text will help researchers in STEM and the social sciences navigate the complexities of academic research in the international research community. Utilizing a combination of text, visuals, and reflection, readers will learn to establish themselves as researchers in the academic community.
Social data analysis enables you, as a researcher, to organize the facts …
Social data analysis enables you, as a researcher, to organize the facts you collect during your research. Your data may have come from a questionnaire survey, a set of interviews, or observations. They may be data that have been made available to you from some organization, national or international agency or other researchers. Whatever their source, social data can be daunting to put together in a way that makes sense to you and others.
When we come across a graph, a chart, or an infographic, how …
When we come across a graph, a chart, or an infographic, how do we know if it is telling the truth? Often, numbers and data convey an authority that is hard to dispute, especially when they are arranged visually in a compelling way. Yet, data, in the ways it is gathered and shared, can be misrepresented and portray a slanted reality rather than a more accurate depiction.
This workshop introduces the concept of data literacy, or the ability to comprehend and interpret data, as a method of cultivating a critical mindset towards representations of information. Participants will learn how to discern misleading data visualizations and collaborate with others in developing strategies for analyzing data that is more accurate and useful. All consumers of information, especially undergraduate students, are encouraged to attend.
By the end of this workshop, participants will be able to:
* Understand what data is and how it is used for rhetorical, commercial, and political purposes
* Identify errors and discrepancies in how data is produced and represented
* Engage with data visualizations in multiple contexts with a healthy degree of skepticism
* Communicate their interpretations of data with their peers
No restrictions on your remixing, redistributing, or making derivative works. Give credit to the author, as required.
Your remixing, redistributing, or making derivatives works comes with some restrictions, including how it is shared.
Your redistributing comes with some restrictions. Do not remix or make derivative works.
Most restrictive license type. Prohibits most uses, sharing, and any changes.
Copyrighted materials, available under Fair Use and the TEACH Act for US-based educators, or other custom arrangements. Go to the resource provider to see their individual restrictions.