6.780 covers statistical modeling and the control of semiconductor fabrication processes and …
6.780 covers statistical modeling and the control of semiconductor fabrication processes and plants. Topics include design of experiments, response surface modeling, and process optimization; defect and parametric yield modeling; process/device/circuit yield optimization; monitoring, diagnosis, and feedback control of equipment and processes; analysis and scheduling of semiconductor manufacturing operations.
This course is an introduction to statistical data analysis. Topics are chosen …
This course is an introduction to statistical data analysis. Topics are chosen from applied probability, sampling, estimation, hypothesis testing, linear regression, analysis of variance, categorical data analysis, and nonparametric statistics.
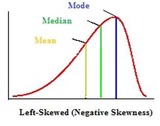
In this section, you will be introduced to numerical summaries that describe …
In this section, you will be introduced to numerical summaries that describe the center of the distribution to include the mean, median, and mode. You will learn how to construct and interpret a box-and-whisker plot as a way to summarize and display quantitative data.
In this section, you will learn how to perform multiple comparison procedures …
In this section, you will learn how to perform multiple comparison procedures to conduct comparisons of the groups when there are more than two levels of the independent variable. Specifically, the Tukey-Kramer procedure.
In this section, you will be introduced to the process of performing …
In this section, you will be introduced to the process of performing a hypothesis test using a four-step testing procedure for two-sample testing. Specifically, you will learn how to perform the large sample test for the difference in population proportions.
In the previous section, you were introduced to the concepts testing a …
In the previous section, you were introduced to the concepts testing a population proportion. In this section, we will extend this to testing population means.
The students will play a classic game from a popular show. Through …
The students will play a classic game from a popular show. Through this they will see the probabilty that the ball will land each of the numbers with more accurate results coming from repeated testing.
Today, artificial intelligence (AI) has become a major factor in driving sustainable …
Today, artificial intelligence (AI) has become a major factor in driving sustainable development. AI technology facilitate the innovation and creativity that could be used to achieved the sustainable development goals SDG, where education is the third SDG. Since the emergence of an advanced language model supported by AI, ChatGPT has been widely used in various fields, including education. Perhaps the fields of mathematics in general and statistics, in particular, are among the most important. Therefore, this study was conducted to investigate the impact of ChatGPT-based learning on statistical reasoning and attitudes towards statistics among undergraduates. The study followed a quasi-experimental design. To achieve their objectives, the researchers employed two valid and reliable assessments: the statistical reasoning assessment and the attitude toward statistics measure. The study sample included 56 students from the Arab Open University in Jordan and was distributed into two groups: experimental and control. The results demonstrated the effectiveness of using ChatGPT in developing statistical reasoning and fostering positive attitudes towards statistics. These findings encourage statistics instructors to incorporate ChatGPT into their teaching methods and motivate students to utilize it in their learning of statistics.
Passion-Driven Statistics is an NSF-funded, multidisciplinary, project-based curriculum that supports students in …
Passion-Driven Statistics is an NSF-funded, multidisciplinary, project-based curriculum that supports students in conducting data-driven research, asking original questions, and communicating methods and results using the language of statistics. The curriculum supports students to work with existing data covering psychology, health, earth science, government, business, education, biology, ecology and more. From existing data, students are able to pose questions of personal interest and then use statistical software (e.g. SAS, R, Python, Stata, SPSS) to answer them. The e-book is presented in pdf format for ease of use across platforms. Check out our public website http://passiondrivenstatistics.com/.Email Kristin.Flaming@gmail.com for access to our FREE faculty resources.
As part of our NSF-funded passion-driven statistics project, we have just started …
As part of our NSF-funded passion-driven statistics project, we have just started to share more widely our “translation code” aimed at supporting folks in learning code-based software and in moving more easily between them. The pdf includes all of the basic syntax for managing, displaying and analyzing data, translated across SAS, R, Python, Stata and SPSS. http://bit.ly/PDSTranslationCode For more information about our full project and access to all faculty resources, email Kristin.Flaming@gmail.com
We hope readers will take away three ideas from this book in …
We hope readers will take away three ideas from this book in addition to forming a foundation of statistical thinking and methods.
(1) Statistics is an applied field with a wide range of practical applications.
(2) You don't have to be a math guru to learn from interesting, real data.
(3) Data are messy, and statistical tools are imperfect. However, when you understand the strengths and weaknesses of these tools, you can use them to learn interesting things about the world.
This textbook is an adaptation of the Research Methods in Psychology that …
This textbook is an adaptation of the Research Methods in Psychology that is available on this site in US and Canadian editions. This New Zealand edition is an adaptation to the New Zealand context. The main changes are in Chapters 1 and 3 and the spelling, grammar, and terminology are changed throughout. This textbook is adopted at the University of Waikato in our 200-level research methods in psychology class.
We are constantly bombarded by information, and finding a way to filter …
We are constantly bombarded by information, and finding a way to filter that information in an objective way is crucial to surviving this onslaught with your sanity intact. This is what statistics, and logic we use in it, enables us to do. Through the lens of statistics, we learn to find the signal hidden in the noise when it is there and to know when an apparent trend or pattern is really just randomness. The study of statistics involves math and relies upon calculations of numbers. But it also relies heavily on how the numbers are chosen and how the statistics are interpreted.
This work was created as part of the University of Missouri’s Affordable and Open Access Educational Resources Initiative (https://www.umsystem.edu/ums/aa/oer). The contents of this work have been adapted from the following Open Access Resources: Online Statistics Education: A Multimedia Course of Study (http://onlinestatbook.com/). Project Leader: David M. Lane, Rice University. Changes to the original works were made by Dr. Garett C. Foster in the Department of Psychological Sciences to tailor the text to fit the needs of the introductory statistics course for psychology majors at the University of Missouri – St. Louis. Materials from the original sources have been combined, reorganized, and added to by the current author, and any conceptual, mathematical, or typographical errors are the responsibility of the current author.
The Art of the Probable" addresses the history of scientific ideas, in …
The Art of the Probable" addresses the history of scientific ideas, in particular the emergence and development of mathematical probability. But it is neither meant to be a history of the exact sciences per se nor an annex to, say, the Course 6 curriculum in probability and statistics. Rather, our objective is to focus on the formal, thematic, and rhetorical features that imaginative literature shares with texts in the history of probability. These shared issues include (but are not limited to): the attempt to quantify or otherwise explain the presence of chance, risk, and contingency in everyday life; the deduction of causes for phenomena that are knowable only in their effects; and, above all, the question of what it means to think and act rationally in an uncertain world. Our course therefore aims to broaden students’ appreciation for and understanding of how literature interacts with--both reflecting upon and contributing to--the scientific understanding of the world. We are just as centrally committed to encouraging students to regard imaginative literature as a unique contribution to knowledge in its own right, and to see literary works of art as objects that demand and richly repay close critical analysis. It is our hope that the course will serve students well if they elect to pursue further work in Literature or other discipline in SHASS, and also enrich or complement their understanding of probability and statistics in other scientific and engineering subjects they elect to take.
This is a free textbook teaching introductory statistics for undergraduates in Psychology. …
This is a free textbook teaching introductory statistics for undergraduates in Psychology. This textbook is part of a larger OER course package for teaching undergraduate statistics in Psychology, including this textbook, a lab manual, and a course website. All of the materials are free and copiable, with source code maintained in Github repositories.
Statistical thinking is a way of understanding a complex world by describing …
Statistical thinking is a way of understanding a complex world by describing it in relatively simple terms that nonetheless capture essential aspects of its structure, and that also provide us some idea of how uncertain we are about our knowledge. The foundations of statistical thinking come primarily from mathematics and statistics, but also from computer science, psychology, and other fields of study.
Why study Quantitative Literacy? Most students sign up for this course to …
Why study Quantitative Literacy?
Most students sign up for this course to fulfill a general education mathematics requirement. And this text is certainly aimed at that general audience. But by the time the course is completed, the authors hope that you will have developed some appreciation for the usefulness and elegance of the subject. Without doubt, some level of competency and comfort in working with numerical data is needed to navigate the modern world; and we have tried to cover topics that can be used in day to day life.
In this book, we will focus on problem solving and critical thinking skills. Our goal is not to prepare you just for the next math class, but to equip you with the necessary tools so that you can apply basic mathematical reasoning to a wide variety of commonly encountered problems. Along the way, we will learn basic logic, how to work with percentages and units, the basics of consumer finance, and how to use and interpret basic statistical data.
This course is an arithmetic course intended for college students, covering whole …
This course is an arithmetic course intended for college students, covering whole numbers, fractions, decimals, percents, ratios and proportions, geometry, measurement, statistics, and integers using an integrated geometry and statistics approach. The course uses the late integers modelintegers are only introduced at the end of the course.
No restrictions on your remixing, redistributing, or making derivative works. Give credit to the author, as required.
Your remixing, redistributing, or making derivatives works comes with some restrictions, including how it is shared.
Your redistributing comes with some restrictions. Do not remix or make derivative works.
Most restrictive license type. Prohibits most uses, sharing, and any changes.
Copyrighted materials, available under Fair Use and the TEACH Act for US-based educators, or other custom arrangements. Go to the resource provider to see their individual restrictions.