Introductory Business Statistics is designed to meet the scope and sequence requirements …
Introductory Business Statistics is designed to meet the scope and sequence requirements of the one-semester statistics course for business, economics, and related majors. Core statistical concepts and skills have been augmented with practical business examples, scenarios, and exercises. The result is a meaningful understanding of the discipline, which will serve students in their business careers and real-world experiences.
This resource is a collection of short closed-captioned lectures that accompany the …
This resource is a collection of short closed-captioned lectures that accompany the power points covering most of chapters 1,2,3, 6, 9, 11, 12, and 13 of the OpenStax Introductory Statistics book. The Power Points are provided in both .PPT and .PDF format to accommodate downloading ease. The notes are in .DOC format.es of Statistics.
This resource is a collection of short closed-captioned lectures that accompany the …
This resource is a collection of short closed-captioned lectures that accompany the power points covering most of chapters 1,2,3, 6, 9, 11, 12, and 13 of the OpenStax Introductory Statistics book. The Power Points are provided in both .PPT and .PDF format to accommodate downloading ease. The notes are in .DOC format. Subject: Mathematics
Here is the link to the new Passion-Driven Statistics e-book! http://bit.ly/Passion-DrivenStatistics Passion-Driven …
Here is the link to the new Passion-Driven Statistics e-book!
http://bit.ly/Passion-DrivenStatistics
Passion-Driven Statistics is an NSF-funded, multidisciplinary, project-based curriculum that supports students in conducting data-driven research, asking original questions, and communicating methods and results using the language of statistics. The curriculum supports students to work with existing data covering psychology, health, earth science, government, business, education, biology, ecology and more. From existing data, students are able to pose questions of personal interest and then use statistical software (e.g. SAS, R, Python, Stata, SPSS) to answer them. The e-book is presented in pdf format for ease of use across platforms. It can also be customized by downloading and editing the .iba file (available through the link below) using the free “iBook Author” software.
http://bit.ly/EditPDSe-book
For more information, contact Lisa Dierker, ldierker@wesleyan.edu or check out the Passion-Driven Statistics website at https://passiondrivenstatistics.com/
Fundamentals of characterizing and recognizing patterns and features of interest in numerical …
Fundamentals of characterizing and recognizing patterns and features of interest in numerical data. Basic tools and theory for signal understanding problems with applications to user modeling, affect recognition, speech recognition and understanding, computer vision, physiological analysis, and more. Decision theory, statistical classification, maximum likelihood and Bayesian estimation, non-parametric methods, unsupervised learning and clustering. Additional topics on machine and human learning from active research.
The students will play a classic game from a popular show. Through …
The students will play a classic game from a popular show. Through this they will see the probabilty that the ball will land each of the numbers with more accurate results coming from repeated testing.
Prediction is at the heart of almost every scientific discipline, and the …
Prediction is at the heart of almost every scientific discipline, and the study of generalization (that is, prediction) from data is the central topic of machine learning and statistics, and more generally, data mining. Machine learning and statistical methods are used throughout the scientific world for their use in handling the "information overload" that characterizes our current digital age. Machine learning developed from the artificial intelligence community, mainly within the last 30 years, at the same time that statistics has made major advances due to the availability of modern computing. However, parts of these two fields aim at the same goal, that is, of prediction from data. This course provides a selection of the most important topics from both of these subjects.
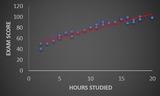
In this section, you will learn the introductory concepts of a simple …
In this section, you will learn the introductory concepts of a simple linear regression analysis including a discussion on the explanatory and response variables in the study. You will learn how to analyze the strength and predictability of regression models.
In this section, you will learn how to analyze the strength and …
In this section, you will learn how to analyze the strength and predictability of regression models and how to perform a significance test to statistically see if a linear relationship exists between the explanatory and response variables.
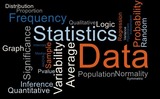
In this section, you will be introduced to important statistical terms. You …
In this section, you will be introduced to important statistical terms. You will learn the difference between a population vs sample, parameter vs. statistic, descriptive vs inferential statistics. You’ll learn how to differentiate between quantitative and qualitative data. You will be introduced to a six-step data analysis process.
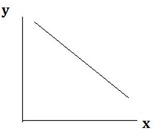
In this section you’ll learn how to create and interpret various graphical …
In this section you’ll learn how to create and interpret various graphical displays of data. You will be introduced to selecting the appropriate graphical display for the data given. You will learn how to construct and interpret graphs for qualitative data and graphs for quantitative data.
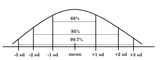
In this section you’ll learn how to calculate measures of spread to …
In this section you’ll learn how to calculate measures of spread to include sample variance and standard deviation. You will apply the Empirical Rule to normally distributed data and find measures of relative standing.
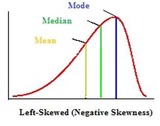
In this section, you will be introduced to numerical summaries that describe …
In this section, you will be introduced to numerical summaries that describe the center of the distribution to include the mean, median, and mode. You will learn how to construct and interpret a box-and-whisker plot as a way to summarize and display quantitative data.
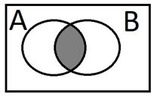
In this section, you will be introduced to the concept of probability …
In this section, you will be introduced to the concept of probability and how it applies to real-world problems. You will learn important vocabulary in probability theory including simple event, event, sample space. You will learn the difference between mutually exclusive and independent events.
In the previous section, you were introduced to the basic concepts of …
In the previous section, you were introduced to the basic concepts of probability theory. In this section you’ll learn how to apply the theory to calculating various types of probabilities using two-way tables (contingency tables).
In this section, you will be introduced to the concept of probability …
In this section, you will be introduced to the concept of probability distributions. You will be able to identify the properties and differences between discrete and continuous probability distributions. You will build discrete probability distributions from chance experiments.
No restrictions on your remixing, redistributing, or making derivative works. Give credit to the author, as required.
Your remixing, redistributing, or making derivatives works comes with some restrictions, including how it is shared.
Your redistributing comes with some restrictions. Do not remix or make derivative works.
Most restrictive license type. Prohibits most uses, sharing, and any changes.
Copyrighted materials, available under Fair Use and the TEACH Act for US-based educators, or other custom arrangements. Go to the resource provider to see their individual restrictions.