This google drive has notes for an Elementary Statistics I course. The …
This google drive has notes for an Elementary Statistics I course. The chapter and sections numbers correspond to the OER textbook by Openstax, Introductory Statistics.
This google drive has notes for an Elementary Statistics II course. The …
This google drive has notes for an Elementary Statistics II course. The chapter and section numbers correspond to the OER textbook by Openstax, Introductory Statistics.
This resource contains class notes and exercises for a course on Fundamental …
This resource contains class notes and exercises for a course on Fundamental Statistics. Each section is provided in its own Google Doc to allow for remixing and adapting as needed.
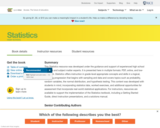
This Statistics resource was developed under the guidance and support of experienced …
This Statistics resource was developed under the guidance and support of experienced high school teachers and subject matter experts. It is presented here in multiple formats: PDF, online, and low-cost print. Statistics offers instruction in grade-level appropriate concepts and skills in a logical, engaging progression that begins with sampling and data and covers topics such as probability, random variables, the normal distribution, and hypothesis testing. This content was developed with students in mind, incorporating statistics labs, worked exercises, and additional opportunities for assessment that incorporate real-world statistical applications. For instructors, resources are available to support the implementation of the Statistics textbook, including a Getting Started Guide, direct instruction presentations, and a solutions manual.
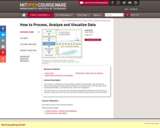
This course is an introduction to data cleaning, analysis and visualization. We …
This course is an introduction to data cleaning, analysis and visualization. We will teach the basics of data analysis through concrete examples. You will learn how to take raw data, extract meaningful information, use statistical tools, and make visualizations. This was offered as a non-credit course during the Independent Activities Period (IAP), which is a special 4-week term at MIT that runs from the first week of January until the end of the month.
The book aims to provide a more holistic approach to supplement traditional …
The book aims to provide a more holistic approach to supplement traditional statistics textbooks. It includes deriving hypotheses from research questions, explaining statistical power and Type II error more in-depth, emphasizing conceptual understanding over calculations, using software for computations, adding interactive animations, and providing Excel data sets. Preliminary student results showed increased engagement and comprehension of hypothesis testing logic after incorporating a holistic approach.
The book is published under a Creative Commons license to make it freely available to students, as the author believes in open sharing of educational resources. The introduction references stories about drug research failures to illustrate Type I and Type II errors and includes a poem about blind men feeling different elephant parts to represent flaws in reductionist-only research. Overall, the book seeks to bring a more holistic perspective to the traditionally reductionist inferential statistics curriculum.
This course provides graduate students in the sciences with an intensive introduction …
This course provides graduate students in the sciences with an intensive introduction to applied statistics. Topics include descriptive statistics, probability, non-parametric methods, estimation methods, hypothesis testing, correlation and linear regression, simulation, and robustness considerations. Calculations will be done using handheld calculators and the Minitab Statistical Computer Software.
Introduction to Financial Mathematics: Concepts and Computational Methods serves as a primer …
Introduction to Financial Mathematics: Concepts and Computational Methods serves as a primer in financial mathematics with a focus on conceptual understanding of models and problem solving. It includes the mathematical background needed for risk management, such as probability theory, optimization, and the like. The goal of the book is to expose the reader to a wide range of basic problems, some of which emphasize analytic ability, some requiring programming techniques and others focusing on statistical data analysis. In addition, it covers some areas which are outside the scope of mainstream financial mathematics textbooks. For example, it presents marginal account setting by the CCP and systemic risk, and a brief overview of the model risk. Inline exercises and examples are included to help students prepare for exams on this book.
We are constantly bombarded by information, and finding a way to filter …
We are constantly bombarded by information, and finding a way to filter that information in an objective way is crucial to surviving this onslaught with your sanity intact. This is what statistics, and logic we use in it, enables us to do. Through the lens of statistics, we learn to find the signal hidden in the noise when it is there and to know when an apparent trend or pattern is really just randomness. The study of statistics involves math and relies upon calculations of numbers. But it also relies heavily on how the numbers are chosen and how the statistics are interpreted.
This work was created as part of the University of Missouri’s Affordable and Open Access Educational Resources Initiative (https://www.umsystem.edu/ums/aa/oer). The contents of this work have been adapted from the following Open Access Resources: Online Statistics Education: A Multimedia Course of Study (http://onlinestatbook.com/). Project Leader: David M. Lane, Rice University. Changes to the original works were made by Dr. Garett C. Foster in the Department of Psychological Sciences to tailor the text to fit the needs of the introductory statistics course for psychology majors at the University of Missouri – St. Louis. Materials from the original sources have been combined, reorganized, and added to by the current author, and any conceptual, mathematical, or typographical errors are the responsibility of the current author.
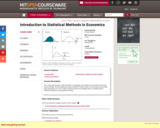
" This course will provide a solid foundation in probability and statistics …
" This course will provide a solid foundation in probability and statistics for economists and other social scientists. We will emphasize topics needed for further study of econometrics and provide basic preparation for 14.32. Topics include elements of probability theory, sampling theory, statistical estimation, and hypothesis testing."
The target audience for this book is college students who are required …
The target audience for this book is college students who are required to learn statistics, students with little background in mathematics and often no motivation to learn more. It is assumed that the students do have basic skills in using computers and have access to one. Moreover, it is assumed that the students are willing to actively follow the discussion in the text, to practice, and more importantly, to think.
Introduction to Statistics is a resource for learning and teaching introductory statistics. …
Introduction to Statistics is a resource for learning and teaching introductory statistics. This work is in the public domain. Therefore, it can be copied and reproduced without limitation. However, we would appreciate a citation where possible. Please cite as: Online Statistics Education: A Multimedia Course of Study (http://onlinestatbook.com/). Project Leader: David M. Lane, Rice University. Instructor's manual, PowerPoint Slides, and additional questions are available.
This book is meant to be a textbook for a standard one-semester …
This book is meant to be a textbook for a standard one-semester introductory statistics course for general education students. Our motivation for writing it is twofold: 1.) to provide a low-cost alternative to many existing popular textbooks on the market; and 2.) to provide a quality textbook on the subject with a focus on the core material of the course in a balanced presentation. The high cost of textbooks has spiraled out of control in recent years. The high frequency at which new editions of popular texts appear puts a tremendous burden on students and faculty alike, as well as the natural environment. Against this background we set out to write a quality textbook with materials such as examples and exercises that age well with time and that would therefore not require frequent new editions. Our vision resonates well with the publisher’s business model which includes free digital access, reduced paper prints, and easy customization by instructors if additional material is desired.
This course covers descriptive statistics, the foundation of statistics, probability and random …
This course covers descriptive statistics, the foundation of statistics, probability and random distributions, and the relationships between various characteristics of data. Upon successful completion of the course, the student will be able to: Define the meaning of descriptive statistics and statistical inference; Distinguish between a population and a sample; Explain the purpose of measures of location, variability, and skewness; Calculate probabilities; Explain the difference between how probabilities are computed for discrete and continuous random variables; Recognize and understand discrete probability distribution functions, in general; Identify confidence intervals for means and proportions; Explain how the central limit theorem applies in inference; Calculate and interpret confidence intervals for one population average and one population proportion; Differentiate between Type I and Type II errors; Conduct and interpret hypothesis tests; Compute regression equations for data; Use regression equations to make predictions; Conduct and interpret ANOVA (Analysis of Variance). (Mathematics 121; See also: Biology 104, Computer Science 106, Economics 104, Psychology 201)
The main goal of the course is to highlight the general assumptions …
The main goal of the course is to highlight the general assumptions and methods that underlie all statistical analysis. The purpose is to get a good understanding of the scope, and the limitations of these methods. We also want to learn as much as possible about the assumptions behind the most common methods, in order to evaluate if they apply with reasonable accuracy to a given situation. Our goal is not so much learning bread and butter techniques: these are pre-programmed in widely available and used software, so much so that a mechanical acquisition of these techniques could be quickly done "on the job". What is more challenging is the evaluation of what the results of a statistical procedure really mean, how reliable they are in given circumstances, and what their limitations are.Login: guest_oclPassword: ocl
The book "Introductory Business Statistics" by Thomas K. Tiemann explores the basic …
The book "Introductory Business Statistics" by Thomas K. Tiemann explores the basic ideas behind statistics, such as populations, samples, the difference between data and information, and most importantly sampling distributions. The author covers topics including descriptive statistics and frequency distributions, normal and t-distributions, hypothesis testing, t-tests, f-tests, analysis of variance, non-parametric tests, and regression basics. Using real-world examples throughout the text, the author hopes to help students understand how statistics works, not just how to "get the right number."
Introductory Business Statistics is designed to meet the scope and sequence requirements …
Introductory Business Statistics is designed to meet the scope and sequence requirements of the one-semester statistics course for business, economics, and related majors. Core statistical concepts and skills have been augmented with practical business examples, scenarios, and exercises. The result is a meaningful understanding of the discipline, which will serve students in their business careers and real-world experiences.
"Introductory Business Statistics with Interactive Spreadsheets - 1st Canadian Edition" is an …
"Introductory Business Statistics with Interactive Spreadsheets - 1st Canadian Edition" is an adaptation of Thomas K. Tiemann's book, "Introductory Business Statistics". In addition to covering basics such as populations, samples, the difference between data and information, and sampling distributions, descriptive statistics and frequency distributions, normal and t-distributions, hypothesis testing, t-tests, f-tests, analysis of variance, non-parametric tests, and regression basics, the following information has been added: the chi-square test and categorical variables, null and alternative hypotheses for the test of independence, simple linear regression model, least squares method, coefficient of determination, confidence interval for the average of the dependent variable, and prediction interval for a specific value of the dependent variable. This new edition also allows readers to learn the basic and most commonly applied statistical techniques in business in an interactive way -- when using the web version -- through interactive Excel spreadsheets. All information has been revised to reflect Canadian content.
Introductory Business Statistics with Interactive Spreadsheets - 1st Canadian Edition is an …
Introductory Business Statistics with Interactive Spreadsheets - 1st Canadian Edition is an adaptation of Thomas K. Tiemann's book, Introductory Business Statistics. In addition to covering basics such as populations, samples, the difference between data and information, and sampling distributions, descriptive statistics and frequency distributions, normal and t-distributions, hypothesis testing, t-tests, f-tests, analysis of variance, non-parametric tests, and regression basics, the following information has been added: the chi-square test and categorical variables, null and alternative hypotheses for the test of independence, simple linear regression model, least squares method, coefficient of determination, confidence interval for the average of the dependent variable, and prediction interval for a specific value of the dependent variable. This new edition also allows readers to learn the basic and most commonly applied statistical techniques in business in an interactive way -- when using the web version -- through interactive Excel spreadsheets. All information has been revised to reflect Canadian content.
No restrictions on your remixing, redistributing, or making derivative works. Give credit to the author, as required.
Your remixing, redistributing, or making derivatives works comes with some restrictions, including how it is shared.
Your redistributing comes with some restrictions. Do not remix or make derivative works.
Most restrictive license type. Prohibits most uses, sharing, and any changes.
Copyrighted materials, available under Fair Use and the TEACH Act for US-based educators, or other custom arrangements. Go to the resource provider to see their individual restrictions.